Showing posts with label SA. Show all posts

11 April 2023

the so-called "semi-modes"

Below an interesting article by SergUA6 (RIP) from radioscanner.ru about MSK, GMSK, SDPSK, and OQPSK: more info and examples here:
http://signals.radioscanner.ru/info/item68/ 
http://signals.radioscanner.ru/info/item281/ 

The "two-faced" signals, such as MSK and GMSK I name semi-modes, of course, it is not the standard name. It simply was required to allocate somehow this class of signals from the general PSK family, because such signals possessing both PSK signs and FSK signs.

The second harmonic of these semi-modes, has two bright spectral lines, the spacing between these lines is equal to Br, that is one of the signs of these modes.This is the necessary condition of their definition at the analysis, but not the sufficient one. Two lines in the second degree/power can be also given by both SDPSK and OQPSK modes.

SDPSK, generally, does not demand synchronism of transitions in extremums of the carrier, and because of this, it has the bigger width of the spectrum than MSK. This width of the spectrum can be reduced by filtering of the bit-stream before feeding on the modulator, this procedure is usually realizing through RRC filters. SDPSK (PSK-2 with phase rotation) in essence, has same resulting signal as MSK, only with wider spectrum. It can also be demodulated by FSK demodulator, becos of getting under definition of semi-modes.

Modern methods of creation of the various signals do often erase the distinction between various modes, for the reason, that developers are almost always (it strongly simplifies development) aspire to select a multiple relation between the clock frequency of manipulation and the frequency of the carrier.
In this case developer declares and forms, for example,that the modulation is SDPSK, but the resulting signal, in essence, is MSK. Thus, casually or deliberately some confusion is brought into diversity of the various modes and their definitions.

Very often GFSK modulation is specified,in descriptions of the signals, while in actual fact it is typical SDPSK according to all signs. The example is the signal of the Finnish radiosonde.
When we are looking at the circuit of formation of GFSK modulation, it is easy to understand that if the clock frequency and the generator will be synchronized, and the frequency spacing will be choosen as BR/2, then such “GFSK” will easily turn into one of our semi-modes, at defined parameters of Gaussian filter and high stability of generator’s parameters. Seems like developers just don’t think about it or just do not know.
By the way, in one’s time, by this reason, GFSK was mistakenly classified to these semi-modes on one of sites the modulation ACARS VHF has been declared as GFSK.

In analysis it is very desirable to define what type of modulation is used, at least approximately. It is also necessary to be oriented on the width of the spectrum, which is occupied by the signal and on its form. At pure MSK modulation, width of the spectrum is about 1.5*Br, at GMSK spectrum is lesser than this value, and in it’s limit is very close to theoretical Br, at the same time the spectrum of MSK, GMSK is obviously expressed as bell-looking-like shape/form, at SDPSK the spectrum is more then 1.5*Br. The basic sign of semi-modes is two lines in the second degree/power, the basic but not sufficient, it demands certain accuracy and attention. The spectrums form does also require certain accuracy, because often receivers distort it to unrecognizability, especially if the signal is taking off from AF’s output or from discriminator, in this sense it is much more preferable the I/Q record or IF.

Good luck!

11 September 2022

OFDM-48 and some comments about OFDM analysis with SA

I wanted to further investigate the OFDM-48 signal published a few days ago [1], in particular the "mode" of construction of the signal and consequently the correct PSK modulation used in the channels. Signals Analyzer documentation [2] reports that, according to the method of forming the data channels and pilot tones, it is possible to meet at least three modes of OFDM signals, actually there may be more modes but SA OFDM tool considers the most basic ones:

Mode A:
All channels are formed "as is", including pilot tones. In this case, the pilot tone cannot be chosen arbitrarily, and is assigned from a limited number of suitable candidates. A typical representative of this mode is the WINDRM 51-tone signal.

Mode B:
All channels are configured as potential pilot tones, any channel can be assigned as a pilot. A typical representative of this mode is CIS-12.

Mode C:
Mixed formation type, all channels are formed as they are, according to mode A. But the pilot tone (s) is formed in a special way, according to mode B. In this mode, any channel or channels can be assigned to the pilot . A typical representative is 188-110B-39 tone signal.

In general, it should be noted that mode B is typical for CIS signals and mode C for NATO signals, even if the 16-tone 188-110 App.A signal is formed according to mode B. Of course this is a subdivision that comes from analysis and practice, although it's quite confirmed.  Most likely, in hypothesis, the signals of modes A and C are formed using 2^n dimensional FFT/IFFT algorithms, and signals according to the mode B without these restrictions.

To appreciate their differences, I synthesized two distinct OFDM-48 signals (modes A and B) using the OCG (OFDM Calculator - Generator) tool [3] downloaded from the radioscanner.ru site. The synthesis process requires the calculation of the OFDM parameters ("Calculate") which will then used in the synthesis stage ("Synthese"). The input fields of the "Calculate" tag (see figure 2) must be filled with the appropriate values, among them I chosed the Fmin Fmax values according the bandwidth limits of the original signal after its direct translation (figure 1).

Fig. 1 - direct translation of the original recording

After entered the correct values for FFT_size/2, TonesMin/Max and Fmin/max, the "Calculate" stage returns the relative OFDM parameters (figure 2); it should be noted that the values of SymbolRate and DeltaFreq calculated by the tool correspond exactly to those desired, that is to those obtained at the time from the analysis of the "original" signal (respectively: 50 Baud and 62.5 HZ).

Fig. 2 - computing the OFDM-48 parameters

As said, the values returned by the "Calculate" stage must then be entered in the input fields of the "Sythese" tag to build the desired OFDM signal; values FFT_Size/2 and TonesTotal are the same of the Calculate stage. As shown in figure 3, I synthesized the OFDM-48 signals (MakeOFDM button) according to the A and B modes, both using PSK2 modulation and without pilot tone(s).

Fig. 3 - synthesis of the two OFDM-48 signals

So I went on to analyze the two OFDM signals with the GREAT ADVANTAGE of already knowing their main parameters, especially the "formation" mode and the used modulation (PSK2).
To the facts, if the "mode" used in the analysis match the one used during the formation of the OFDM signal then we will get the actual modulation used in the channels. The following figures 4 and 5 show this evidence: the PSK2 constellation (the modulation actually used in channels) appears only when the "modes" of the analysis and the OFDM formation match; otherwise, the DBPSK constellation appears.

Fig. 4 - analysis of the OFDM-48 PSK2 mode-A signal

Fig. 4 - analysis of the OFDM-48 PSK2 mode-B signal

As proof, I synthesized the same OFDM-48 signal but this time with DBPSK modulation (figures 5 and 6).

Fig. 5
 
Fig. 6 - analysis of the OFDM-48 DBPSK mode-A signal

This means that we can obtain the correct values of the baud rate, spacing and number of channels but if we do not know a priori the used modulation we could face a margin of uncertainty about it. The best way to fix such impasse is to isolate a single channel and analyze it as if it were a normal PSK-n signal but with the foresight to use the differential mode (Diff = 1) when studying its constellation (figures 7,8). However, this is not always possible because it depends on the quality of the recording.

Fig. 7 - OFDM-48 PSK2, single channel verification

Fig. 8 - OFDM-48 DBPSK, single channel verification
 

That done, I tried to trace back to the "native" sampling rate (SR) of the original OFDM-48 signal analyzed in the previous post [1].

(the following comments are from "Analysis OFDM with CP in SA versions 6.2.6.5" [4])
It is well known that in OFDM signals there is a concept called "native sampling frequency" (SR) which has to satisfy some principles:
- SR/Br = x
- SR/Sh = y
where Br is the symbol rate (Baud), Sh is the separation between channels (Hz), and x y are positive integers. The SR frequency has to be a multiple of Br, and its relation to the channel spacing is “native”. On the other hand, we speak of “independence” of the SR frequency and “native” and “non-native” SR frequencies, which must certainly have specific values.

Let's explain this. A given recording has been sampled at a particular rate: we speak of "independence" because that sample frequency does not have to correspond to the "native" frequency. This does not influence or affect the obtaining of the parameters of an OFDM signal, indeed if necessary, the value of SR can be resampled/recalculated as necessary. Since the "native" value of the sample rate is a multiple of both Br and Sh, if we calculate the exact values ​​of Br and Sh, we will have the possibility of estimating a set of SR frequencies SR1, SR2, SR3..., SRn that meet the requirements and in which at least one frequency of them will be the “native” one.

Back to the native SR, if its value is not known but the OFDM signal formation values LU and LG are (1), then the following formula can be used:

SR = (LU + LG) * Br

Well, OCG tool also gives the possibilty to get pairs of LU LG (just "Get LU,LG" tag) according the desidered values of the signal such as channels, shift, and Br. We can choose any LU LG pair but it is better to leave the signal as much as possible as it is, ie without "heavy" resampling and using a pair of values as close as possible to the pair found from the analysis of the original signal [1]. In this case I chose the pair LU = 228  LG = 57 (figure 9), therefore:

SR = (228 + 57) * 50 = 14250 Hz

as you see, the resulting SR frequency is almost the same of the one used when recording the signal.

Fig. 9

The analysis of the signal after its resample at 14250 Hz is shown in figure 10. Since it is assumed to be a CIS signal, and they usually use mode B, it can be said that the modulation used is DBPSK, even if mode A & PSK2 remains equally likely.

Fig. 10 - analysis of the resampled OFDM-48 signal

Without using OCG, a trick to obtain one or more "effective" SR frequencies is to multiply the value of the shift by an positive integer n, ie:
SR = Sh * n  
taking into account the bandwidth occupied by the signal, ie the resulting SR value must be equal to twice the  upper boundary (see Nyquist rate [5]). In this case n would be = 228.
 
(1) the relation between the duration of LG (guard interval) in samples and the duration of LU (length of useful information) in samples gives the factor K (or "Magic K", visible in the OFDM analysis results), since K = LG/LU. Defining a consistent value of K is one of the primary goal/task of the analysis of signals OFDM, knowing this factor it is possible to receive all much more precisely and faster. 


27 May 2020

unid 200Bd/800 FSK (2)

(see the previous post for background)
My friend cryptomaster suggested me an interesting way to measure and analyze the two component frequencies of the 200Bd/800 FSK signal by using the VMW module of SA. Indeed, using that tool it is quite possible to obtain additional phase characteristics of the signals. For this, it is necessary to consider the bitmap picture of the carrier signal, adjusting the scan so that one period of the carrier wave fits on the line of the raster. Two columns of red and blue colors  on the screen of the WMV module reflect the positive and negative half-cycles of the oscillation (Fig. 1).
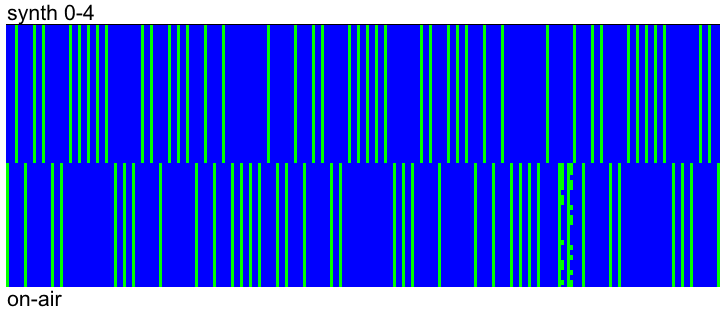
Fig. 1 - oscillation period (thanks to cryptomaster)
Well, it turned out that during the formation of this FSK signal the pahses of the two frequencies are preserved after each "shift" (Figs 2a,2b): that suggests that it's formed by switching (mechanically or electronically) two independent F1 F2 frequency generators which bear some inter-relationships or by using a VCO system.

Fig. 2a - F1 component phase (on a 2 periods view)
Fig. 2b - F2 component phase (on a 3 periods view)
Phase analysis was performed on a signal recorded in IQ mode exactly on its center fequency of 5094.7 KHz: in this case the two values of the frequency generators are:

F1 ~ 5602,6 HZ (2:0,000356972)
F2 ~ 6402,6 Hz (3:0,000468558) 

as expecetd, 800 Hz shift.
Me and cryptomaster discussed these values and he obtained an interesting result recording the signal at a frequency of 5093.50 KHz/usb. In this case, the carriers are equal to F1 = 800Hz F2 = 1600 Hz (Fig. 3).
 
Fig. 3 - F1 F2 components (thanks to cryptomaster)
Probably the lower frequency is obtained using a d
ivide-by-2 circuit. Anyway, examining the signal at different intervals, one can notice a small discrepancy in the phases of these two frequencies (Fig. 4): thus, it is once again proved that the signal is generated by two different generators.

Fig. 4 - discrepancy between F1 F2

30 September 2017

Chinese PSK-2 ...and errors in its baud rate measurement

Some days ago I had a talk (...email exchange) with my friend KarapuZ about the way to get correct measurements of the baud rate in noisy signals or in uncommon waveforms. I always relied on the tools provided by SA program as the "Auto define param" and mostly the amplitude detectors, but KarapuZ warned me that sometimes they may fail and notably the "Auto define param" tool fails in case of strictly filtered or weak signals.
As a test, KarapuZ sent me a sample (the "x-Bd" wav file in Figure 1) without specify its baudarate and asking me to measure it.

Fig. 1
I used the "Auto define" tool and the modified amplitude detector searching for the lower more bright line and got a baud rate of 1000 symbols/sec in both their outputs (Fig. 2).
 
Fig. 2
KarapuZ replied: "The speed line of manipulation is 1500 baud unchanged in the preamble! This is a Chinese PSK-2 modem". 
Indeed, in my measurement I simply took in consideration the lower line - as usual - and did not put attention to the discontinuity in the 1000 Hz (999.44) line between preamble and data segments (Figs. 3,4). Really a my hasty measurement (I already had this signal but I forgot).

Fig. 3
Fig. 4
KarapuZ also drawn my attention on the "raster" of the signal that clearly exhibits 15 bits within 10 msec, ie a speed of 1500 baud (Fig. 5)

Fig. 5
Apart from my error in the evaluation of the amplitude detector, why the SA "Auto define param" failed so clumsily?
Quoting KarapuZ "it can be assumed that in the transmitting equipment, filters are used at the output of the signal formation which in some circumstances may influence the determination of the speed of the manipulation of the SA program." So, in order to demonstrate the influence of the filtering in the Chinese PSK-2 signal, KarapuZ synthesized an absolute PSK-2 modulation at 1500 baud with the same 3-bit structure of the Chinese waveform and sent me that file (Fig. 6)

Fig. 6
Then I measured the manipulation speed of the syntesized signal just using the "Auto define param" and it works like a charm.

Fig. 7
 The influences of the filtering is thus well quantifiable (other than visible)

Fig. 8
Things are even more worse since the bitstream  has a relative form and a three-bit structure, visible in raster, which generates many harmonics in the power spectrum! This is China, they love such tricks :)

Fig. 9
Fig.10
Thanks to KarapuZ for the great lesson!

error in measuring a PSK baud rate


16 May 2016

phase keyed signals, SA, and possible wrong demodulations

Playing with a STANAG-4285 signal and SA (Signals Analayzer) I met some problems in understanding correctly the synchronization sequence pattern of this waveform: the solution is very simple indeed and must be sought in the way the SA phase-plane module demodulator works. Below the story.
 
SA phase-plane demodulating a STANAG-4285 signal
 "The synchronization phase of the STANAG-4285 waveform consists of 80 symbols and is transmitted recurrently every 106.6 ms. This sequence uses 2-bit phase shift keying (2-PSK) modulation and the modulation rate is equal to 2400 bauds. The sequence is identical to a pseudorandom sequence of length 31, which is repeated periodically within the 80-symbol window, i.e., the synchronization sequence consists of 2 periods of length 31 plus the first 18 symbols of another period. A generator for the synchronization sequence is described in pic. 1. The generator polynomial is: x^5 + x^2 +1.
At the beginning of every frame the generator is initially set to the following value: 11010. The first symbol of the synchronization sequence is identical to the least significant bit of this initial value. The remaining 79 symbols are obtained by applying the clock 79 times.
The scrambling operation is carried out on reference and data symbols only, not on the synchronization sequence."
Fig. 1 - S-4285 sync sequence generator
Coding PSK-2 into 8-ary on air is achieved by mapping one-bit to one-symbol according to the following rule in Fig. 2: 
"000" tribit symbol for bit "0" (symbol 0) 
"100" tribit symbol for bit "1" (symbol 4)

Fig. 2 - 0-4 mapping
The S-4285 sync sequence generator can be synthesised running a simple Lua program: since the sync sequence is not subjected to the scrambling, the output file generated by the program is just the STANAG-4285 sync sequence that I need. The synthesised pattern of the sync sequence is visible using a bitstream analyzer (Fig. 3).
 
Fig. 3 - synthetized sync sequence pattern using the 0-4 mapping
Looking at a on-air STANAG-4285 demodulated by SA phase-plane, the 80 symbols sync sequence exhibits a different pattern than the one synthesised (Fig. 4)
 
Fig. 4 - synthesised 0-4 Vs on-air sync sequence patterns

The differences with the on-air signal are more evident looking at the sync sequence generated by a STANG-4285 modem (Fig. 5)
 
Fig. 5 - modem Vs on-air sync sequence patterns
while the synthesised and modem sync sequence patterns are the same, unless the polarity (Fig. 6) 

Fig. 6 - synthesised 0-4 Vs modem sync sequence patterns

Indeed, editing the mapBit() function of the Lua code adding a negative π/4 phase rotation, ie a 7-3 mapping, we get the same sync sequence pattern produced by the modem (Figs. 7,8)
  
local function mapBit(Ubit)
   if (Ubit == "0") then 
      8ary_symbol = {"1","1","1"} -- # symbol number 7
   else  
      8ary_symbol = {"0","1","1"} -- # symbol number 3
   end
    return 8ary_symbol
end

Fig. 7 - 7-3 mapping

Fig. 8 - syntesised 7-3 Vs modem sync sequences pattern
Editing the sync sequence generator, I found that a sequence that macthes the one of the on-air signal can be obtained by using the 4-0 mapping, ie by adding a π phase rotation as shown in Figures 9,10 (unless some uncertainties in the on-air signal):

local function mapBit(Ubit)
   if (Ubit == "0") then 
      8ary_symbol = {"1","0","0"} -- # symbol number 4
   else  
      8ary_symbol = {"0","0","0"} -- # symbol number 0
   end
    return 8ary_symbol
end

Fig. 9 - 4-0 mapping


Fig. 10 - synthesised 4-0 Vs on-air sync sequence patterns

I think that the differences between the sync sequences produced by the sythetiser and the modem and the sync sequence of the on-air signal are due to the phase-plane module of SA. SA is a signal analyzer and not a decoder, therefore its phase-plane demodulator does not sync  any particular protocol, as it happens for example in STANAG-4285 "suited" decoders. Working with phase keyed signals, the SA phane-plane demodulator produces right interpretations and views (number of phases, angles, modulation speed, carrier frequency,...) but it may return wrong demodulated streams due to the possible phase-offset errors.

15 October 2015

how fading or AGC may confuse the things...

looking inside a 3 KHz serial tone, I was puzzled by its 2 x PSK-8 rings unusual constellation: baudrate (3000 symbols/sec) and ACF (640 msec) made me think to the CIS-3000 waveform... but that PSK shape was not the expected one, so I asked my friends Karapuz and Angazu to hear their opinion and they gave me an hint: "hey, look at the amplitude of the signal!".
That's right: highlighting a single chunk of signal and selecting the SA wave form-module, is visible an amplitude variation, possibly due to fading, that in turn causes a sort of inter-symbol distortion in the phase plane and then the optical effetct of the two concentric PSK-8 rings. My wrong because, just in case, before I had to ran the wave-form module. Same conclusions if I had increased the printing delay in the phase plane as an instant-replay.
Well, good to know... especially if tinkering with AGC.
 
the sonogram
the two PSK-8 rings...
...and its clarification

31 July 2015

Using SA to measure and fix sound card digitizer errors

(by Angazu)
All sound cards and A/D converters have some clock error. This is especially true if converters are commercial and cheap ones, like PC sound cards and similar. Professional and expensive converters exhibit a much better clock stability and jitter. To correct this error, one must know nominal parameters of the signal under test. If these parameters are known, it is quite easy to correct digitizing clock error using SA.
 
Information for this doc was obtained from:
Unfortunately, Baudline has no windows version, but the web contents can be useful for the reader.

The SA method of  “Correction of BR” is quite good for this job, but perhaps using resampler as data input is a better procedure.
The correction factor will have to be measured for any digitizing speed and mode. Bear in mind that for cheap cards, the speed can vary due to various factors, so if high precission measurements are required, a new calculus should be carried out. For a good measurement, a quite big signal is needed.
This method is useful for PSK,FSK,MFSK and other modulations. To use it with OFDM, some more operations should be carried out using SA. Ideally, an external signal like GPS 1000 Hz or a signal from a high end signal generator will provide the best results. Also, a radio timing signal should be good enough.
The best way to understand the subject are examples. 

A well known signal as Stanag-4285 (sampled at 8000 sps) will be used to show the method.
We know 4285 has a nominal speed of 2400 sps. Since a frame is 256 symbols, the frame time must be 106,666666 mS. This is the value that should be obtained if using the VMW feature of SA when signal structure is perfectly vertical. As we can see, the measured value is 106,69241


Correction factor = measured value/nominal value = 106.69241/106.66666= 1.000241
Error PPM = (correction factor-1)* 1000000 = (1.000241-1)*1000000=  241 PPM.
Real Digitizing speed = 8000*1.000241 =  8001.931
Real modulation speed (Br) = 2400/1.000241 =  2399.421739
Measured SA Br = 2399.41

Now, lets go to correct the signal using calculated BR in SA.


The signal parameters are almost perfect, so we can save the corrected signal and after this procedure, we can be quite sure the new signal will be demodulated using any comercial demodulator.
Also, we know the correction factor for the used card in that speed.
In this sample, error is quite small and no problem for demodulators, but bear in mind that error can be very  big. I measured errors of more than 100 samples in an 8000 nominal sample rate. That means that demodulators will fail to demodulate the signal and even analysis will be quite complicated and erroneous
.

The MIL-STD 188-110 App.B is a well known OFDM waveform: baudrate 44.44, channel separation 56.25 Hz, 39 tones + I pilot, correlation triangle (k) = 17/64 and modulation "pi/4 DQPSK" in all channels. The analysed sample, although it exibiths the expected 39 +1 tones, is not protocol compliant for what concern baudrate, separation and K (and OFDM parameters too)


The measured clock is 44.48 Hz and according to this article  the signals has a native sample rate of multiple of 3600 Hz.
As said above, go on fixing the baudrate and re-sampling to the correct frequency (7200 Hz in this case)


Although the absolute constellation is not stable, all the mentioned parameters are now correct and the fixed sample can be saved and published.